Mastering Visual Performance: The Ultimate Guide to KPI Gauge Meters and Business Icon Graphics
In the fast-paced world of modern business, data is the new currency. However, raw numbers alone often fail to tell a compelling story or drive immediate action. This is where the concept of visual performance tracking comes into play, bridging the gap between complex analytics and human understanding. At the heart of this visual revolution are KPI Gauge Meters and vibrant business icon vector illustrations. These tools are not merely decorative; they are essential components for communicating success, identifying areas for improvement, and maintaining organizational focus.
Whether you are a seasoned data analyst, a small business owner, a creative designer, or an educator, understanding how to leverage high-quality visual assets like gauge meters can transform the way you present information. This guide explores the significance of these graphics, their practical applications across various industries, and why investing in high-resolution, versatile digital products is a smart move for your professional toolkit.
What is a KPI Gauge Meter?
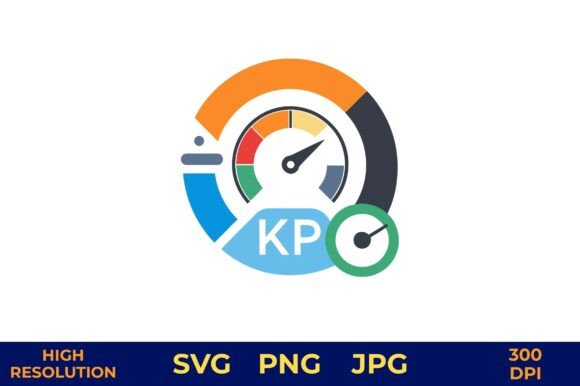
A Key Performance Indicator (KPI) is a measurable value that demonstrates how effectively a company is achieving key business objectives. While KPIs can be tracked in spreadsheets, a KPI Gauge Meter provides an instant visual snapshot of that performance. Imagine the speedometer in your car; you don't need to calculate your velocity in miles per hour mathematically to know if you are speeding. You simply glance at the needle. A gauge meter works on the same psychological principle for business metrics.
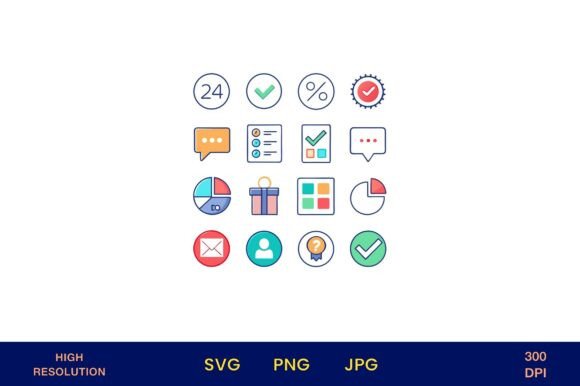
These graphics typically feature a semi-circular or circular dial with color-coded zones—often red for danger or underperformance, yellow for caution, and green for success. By placing a needle or indicator within these zones, stakeholders can instantly grasp the status of a metric, such as sales targets, customer satisfaction scores, or project completion rates. When combined with colorful business icons, these gauges become even more powerful, providing context that pure text cannot convey.
The Power of Vector Illustrations
When selecting graphics for professional use, the file format matters immensely. This is where vector illustrations shine. Unlike raster images (like standard photos) which can become pixelated when enlarged, vector graphics are built on mathematical paths. This means they can be scaled from the size of a business card to a massive billboard without losing any clarity or sharpness.
High-quality digital products in this category often come in formats like SVG (Scalable Vector Graphics), alongside high-resolution PNG and JPG files. An SVG file is particularly valuable for web designers and app developers because it remains crisp on any screen resolution, from mobile phones to 4K monitors. Furthermore, professional packs usually offer transparent backgrounds, allowing you to seamlessly integrate the gauge meter onto any colored background, texture, or photograph without unsightly white boxes surrounding the image.
Why Visual Context Matters in Business and Education
The human brain processes visuals 60,000 times faster than text. In an era of information overload, the ability to communicate quickly and clearly is a competitive advantage. Using a KPI gauge meter with business icons helps reduce cognitive load. Instead of forcing an audience to read a paragraph explaining that "sales are slightly below target but improving," a single graphic with a needle hovering in the yellow zone next to a dollar sign icon conveys the entire message instantly.
This approach fits seamlessly into modern workflows:
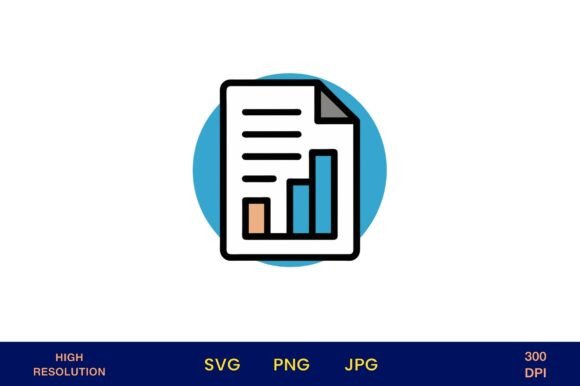
- Corporate Reporting: Enhance quarterly presentations with dynamic visuals that keep board members engaged.
- Dashboards: Create intuitive internal dashboards for employees to track their own performance in real-time.
- Educational Materials: Teachers can use gauge metaphors to explain progress bars in learning modules or classroom behavior charts.
- Marketing Campaigns: Use infographics on social media to showcase company milestones or growth statistics to potential investors.
Clarifying Common Misunderstandings
A common assumption is that these graphics are only useful for corporate finance teams. In reality, the application of KPI gauges is universal. A fitness coach might use a gauge to show a client's progress toward a weight loss goal. A non-profit organization might use one to visualize fundraising targets against donations received. Even in personal productivity, individuals use these visuals in planners to track habits.
Another misconception is that high-quality design requires expensive software skills. With ready-to-use digital products featuring high-quality SVG, PNG, and JPG files at 300 DPI (dots per inch), anyone can incorporate professional-grade designs into their projects. The "just download and print" model democratizes access to premium design assets, allowing users to focus on their message rather than struggling with design tools.
Practical Applications: From Digital Screens to Physical Products
The versatility of a high-resolution 4200px x 4200px digital asset cannot be overstated. Because these files are large and high-definition, they serve a dual purpose: digital display and physical printing. Here is how you can maximize the value of such a resource across different mediums:
1. Social Media and Digital Marketing
In the crowded landscape of social media, eye-catching graphics stop the scroll. You can use colorful KPI illustrations to create "Year in Review" posts, milestone celebrations, or educational carousels explaining industry trends. The transparent background feature ensures your brand colors remain consistent across Instagram, LinkedIn, and Twitter.
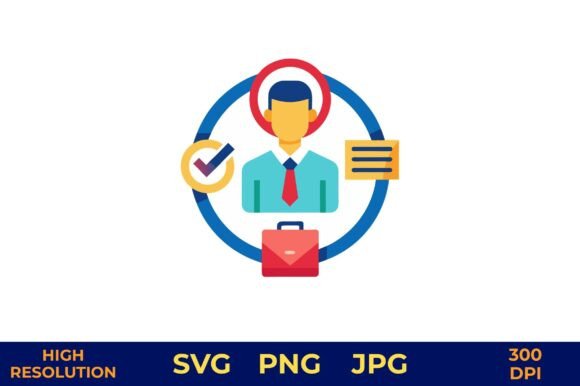
2. Branding and Corporate Identity
Consistency is key to branding. By using a cohesive set of business icons and gauge meters, companies can establish a recognizable visual language. These elements can be incorporated into:
- Branding kits: Define the visual style for internal and external communications.
- Planners and Organizers: Custom printed planners for staff or clients featuring performance tracking pages.
- Photographer and Florist Portfolios: Even creative industries need to track metrics like booking rates or seasonal revenue; these graphics add a professional touch to their business reviews.
3. Event Planning and Wedding Decor
Surprisingly, business-style graphics have found a home in the event industry. Modern weddings and corporate galas often embrace thematic elements that blend professionalism with celebration. High-quality prints can be used for:
- Save the Date cards: Featuring a "countdown" gauge to the big day.
- Wedding menus and seating charts: Using elegant icons to denote dietary restrictions or table themes.
- Bridal shower decor: Creating fun "love meter" games or progress trackers for the couple's journey.
- Table numbers: Stylized with unique icons for each table.
4. Merchandise and Print-on-Demand
With a resolution of 300 DPI and dimensions of 4200px, these images are print-ready for physical merchandise. This opens up opportunities for creating custom goods such as:
- Mugs and Tumblers: Perfect for office gifts or motivational morning coffee cups.
- T-shirts and Pillows: Ideal for team-building events or casual office wear.
- Posters: Large format prints for office walls to keep goals visible.
- Stickers and Tags: Great for packaging, labeling, or rewarding employees.
The Importance of High-Quality Digital Assets
When downloading digital products, quality is paramount. A blurry image can undermine the credibility of your entire presentation. The specific product described—a 1 High Quality SVG, PNG, JPG pack with Transparent Backgrounds—represents the gold standard for digital assets. The inclusion of multiple file types ensures compatibility with almost any software, from Adobe Illustrator and Photoshop to Canva and Microsoft Word.
Furthermore, the 300 DPI specification is critical for printing. Standard screen resolution is 72 DPI, which looks fine on a monitor but appears jagged and fuzzy when printed on paper. A 300 DPI file ensures that whether you are printing a small sticker or a large poster, the edges remain smooth and the colors vibrant.
Note on Digital Delivery
It is important to remember that this is a digital product. No physical item will be shipped to your door. This immediate delivery model allows you to start your project instantly. Once downloaded, the file is yours to use repeatedly, offering immense long-term value compared to hiring a designer for a single custom illustration.
Building a Broader Understanding of Visual Data
Integrating KPI gauge meters and business icons into your workflow is more than just an aesthetic choice; it is a strategic decision to improve communication. By translating abstract data into tangible visuals, you foster a culture of transparency and accountability. Whether you are tracking the success of a marketing campaign, planning a wedding, or designing a new line of apparel, these tools provide the clarity needed to move forward with confidence.
In conclusion, the fusion of data visualization and creative design offers endless possibilities. By utilizing high-resolution, versatile vector illustrations, you empower yourself to tell better stories, make smarter decisions, and create stunning visual experiences. Embrace the power of the gauge meter, and watch how a simple shift in perspective can drive significant results in your personal and professional life.